Debugging Bun with the web debugger
Bun speaks the WebKit Inspector Protocol. To enable debugging when running code with Bun, use the --inspect flag. Consider the following web server.
Bun.serve({
  fetch(req) {
    console.log(req.url);
    return new Response("Hello, world!");
  },
});
Run the file with the --inspect flag.
This starts a WebSocket server on an available port. Debugging tools connect to this server to introspect the running Bun process.
Bun hosts a web-based debugger at debug.bun.sh. It is a modified version of WebKit's Web Inspector Interface, which will look familiar to Safari users.
$ bun --inspect server.ts

--------------------- Bun Inspector ---------------------
Listening:
  ws://localhost:6499/0tqxs9exrgrm
Inspect in browser:
  https://debug.bun.sh/#localhost:6499/0tqxs9exrgrm
--------------------- Bun Inspector ---------------------
Open the provided debug.bun.sh URL in your browser to start a debugging session. From this interface, you can view the source code of the running file, view and set breakpoints, and execute code with the built-in console.
Next, set a breakpoint. Open the Sources tab, which shows the code from earlier, and click line number 3 to set a breakpoint on the console.log(req.url) statement.
Then visit http://localhost:3000 in your browser to send an HTTP request to the server. The page hangs because the program is paused at the breakpoint you set.
Note how the UI has changed.
Use the console at the bottom to run arbitrary code in the context of the program, with full access to the variables in scope at the breakpoint.
The right side of the Sources pane lists the local variables in scope; drill down to see their properties and methods. The screenshot shows the req variable.
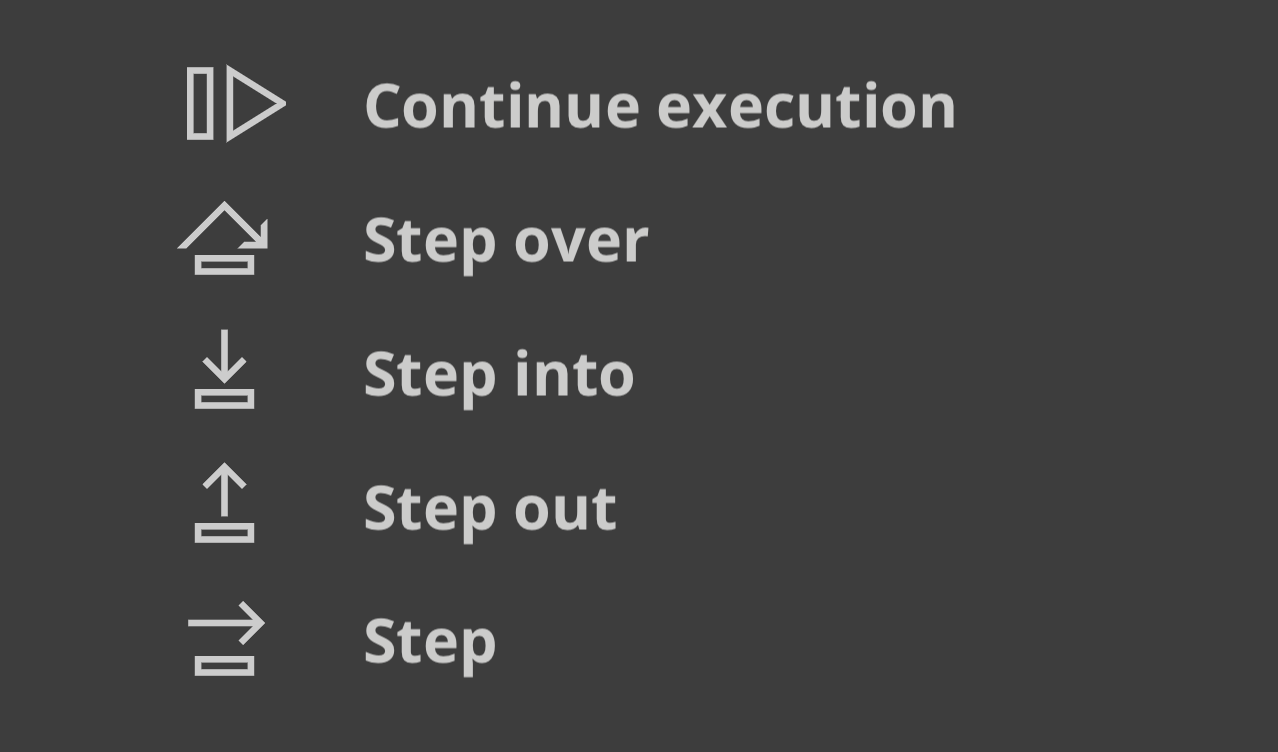
The buttons in the upper left of the Sources pane control the program's execution.
Here's what each control flow button does.
- Continue script execution — runs the program until the next breakpoint or exception.
- Step over — continues to the next line.
- Step into — if the current statement contains a function call, steps into the called function.
- Step out — if the current statement is a function call, finishes executing it, then steps out of the function to the location where it was called.